
Highcharts
Render Highcharts charts as images.
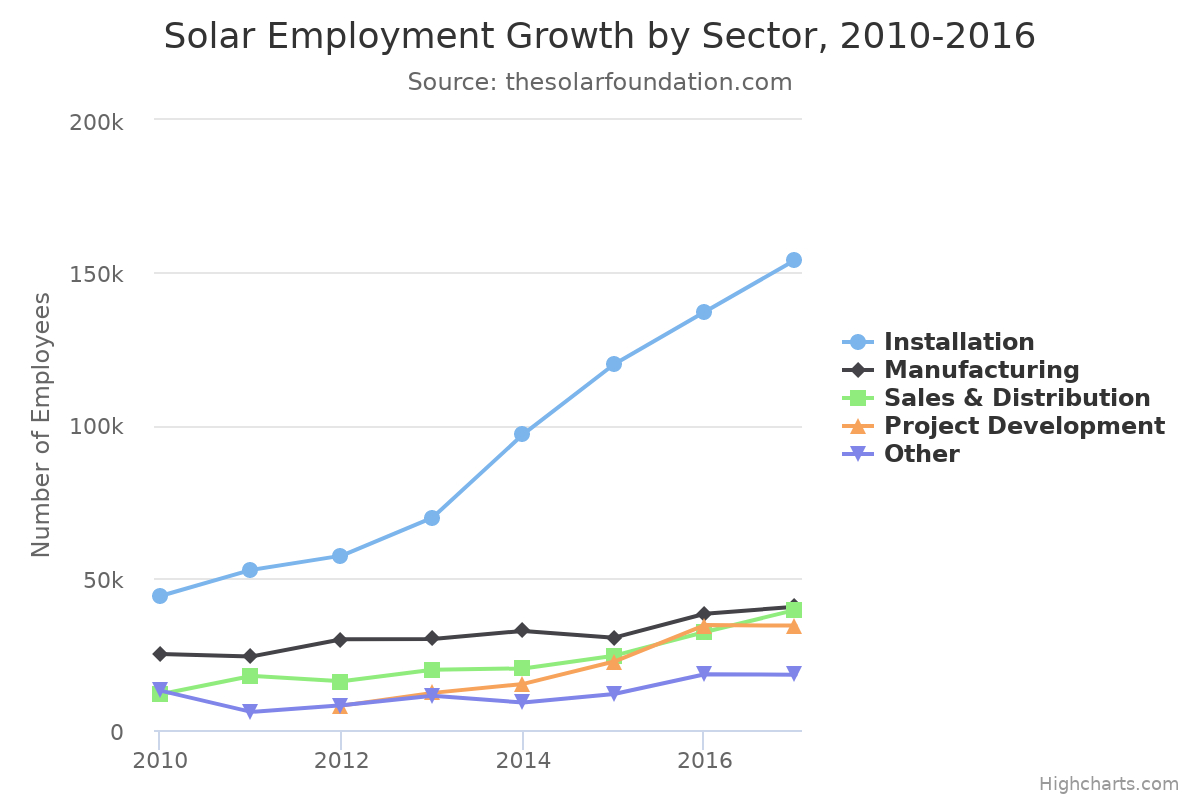
You can generate images of charts using Highcharts.js + the HTML/CSS to Image API.
Example HTML
Section titled “Example HTML”The HCTI API supports JavaScript. Load in highcharts.js via a script tag in your HTML.
<script src="https://code.highcharts.com/highcharts.js"></script><script src="https://code.highcharts.com/modules/series-label.js"></script>
<div id="container"></div>
<script>Highcharts.chart('container', {  chart: {    animation: false  },  title: {    text: 'Solar Employment Growth by Sector, 2010-2016'  },
  subtitle: {    text: 'Source: thesolarfoundation.com'  },
  yAxis: {
    title: {      text: 'Number of Employees'    }  },  legend: {    layout: 'vertical',    align: 'right',    verticalAlign: 'middle'  },
  plotOptions: {    series: {      animation: false,      label: {        connectorAllowed: false      },      pointStart: 2010    }  },
  series: [{    name: 'Installation',    data: [43934, 52503, 57177, 69658, 97031, 119931, 137133, 154175]  }, {    name: 'Manufacturing',    data: [24916, 24064, 29742, 29851, 32490, 30282, 38121, 40434]  }, {    name: 'Sales & Distribution',    data: [11744, 17722, 16005, 19771, 20185, 24377, 32147, 39387]  }, {    name: 'Project Development',    data: [null, null, 7988, 12169, 15112, 22452, 34400, 34227]  }, {    name: 'Other',    data: [12908, 5948, 8105, 11248, 8989, 11816, 18274, 18111]  }],
responsive: { rules: [{ condition: { maxWidth: 500 }, chartOptions: { legend: { layout: 'horizontal', align: 'center', verticalAlign: 'bottom' } } }] }});</script>Need help?
Talk to a human. Email support@htmlcsstoimage.com and we’ll help you get started.