
Using the image debugger
The image debugger helps you understand why an image looks wrong, takes longer than expected, or fails to render. Run an existing image again with its saved settings and watch the render events arrive live, from loading the page to capturing and saving the result.
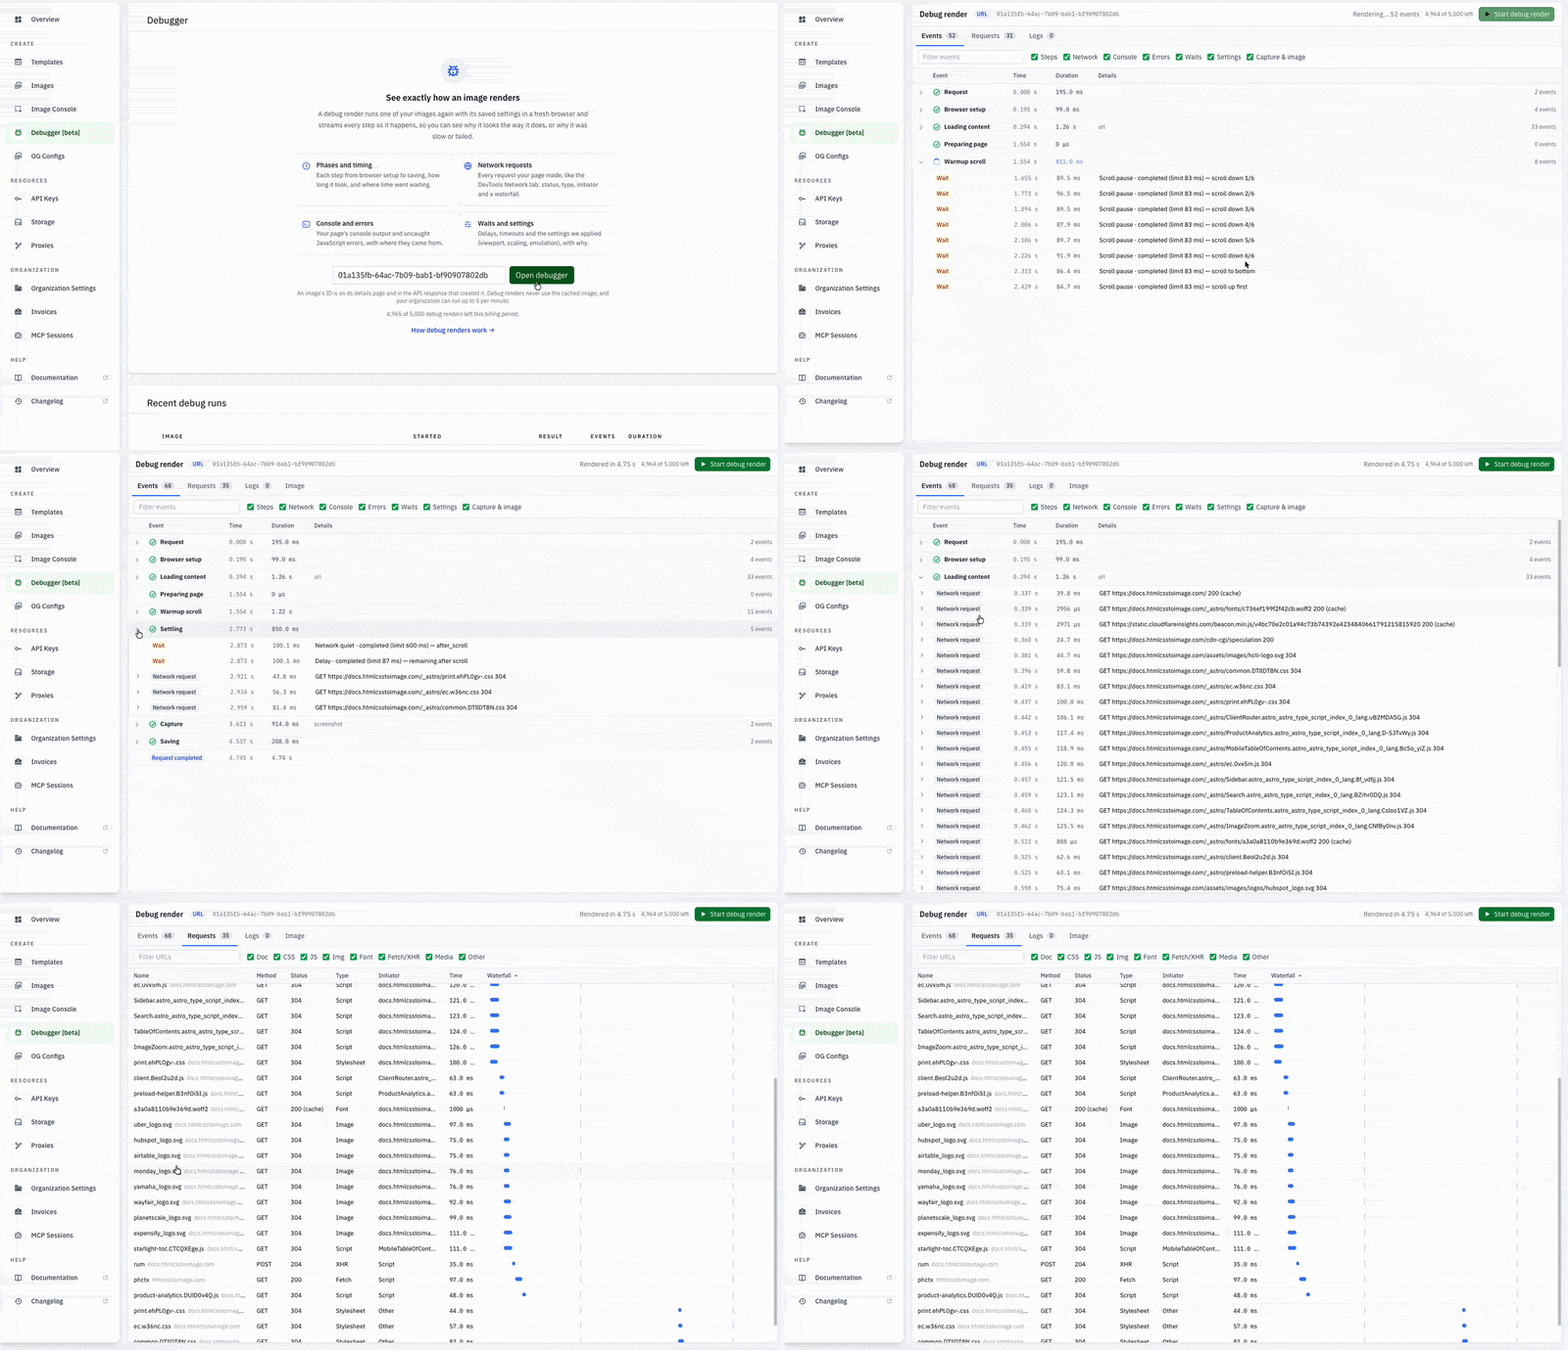
Open the debugger from the dashboard
Section titled “Open the debugger from the dashboard”- Open Images in the dashboard and select the image you want to investigate.
- On the Image details page, click Debug render.
- Click Start debug render to run the image again.
- Inspect the Events, Requests, and Logs tabs as the render runs. Once the output is saved, the Image tab appears.

You can also open Debugger from the dashboard navigation, enter an image ID, and click Open debugger. Find the ID on the image’s details page or in the API response that created it.
Each debug render uses the image’s saved settings and bypasses the cached output to perform a fresh render. For URL screenshots, this loads the page as it exists now; changed content or external resources can produce a different result from the original image.
Explore the render
Section titled “Explore the render”Events: follow each step
Section titled “Events: follow each step”The Events tab groups the timeline into phases such as Request, Browser setup, Loading content, Preparing page, Warmup scroll, Settling, Capture, and Saving. The phases you see depend on the work needed for that image.
Expand a phase to see its events. The Time column shows when an event happened relative to the start of the run, and Duration shows how long a measured operation took. Problem counts help you find phases with errors or timeouts.
Use Filter events to search, or the category checkboxes to focus on Steps, Network, Console, Errors, Waits, Settings, or Capture & image. Expand individual events when available to inspect their details.

Requests: inspect resources and timing
Section titled “Requests: inspect resources and timing”The Requests tab shows the network requests made by the page, including documents, scripts, stylesheets, images, fonts, and data requests. It includes the URL, method, status, resource type, initiator, duration, and a waterfall showing when requests ran and overlapped.
Search for a URL or initiator, filter by resource type, and click a request to inspect its details. Requests can finish, fail, redirect, be served from the browser cache, be blocked, or remain pending when a wait times out. Blocked requests include the reason and the matching request_overrides rule when available.

Logs: read console output and JavaScript errors
Section titled “Logs: read console output and JavaScript errors”The Logs tab includes the page’s console messages and uncaught JavaScript exceptions. Search by message or source and filter by severity. Expand a row to see the recorded text, source location, and stack trace when available.
Use this tab to check whether your page’s scripts ran, whether data loading failed, or whether an exception prevented content from appearing.

Image: inspect the result
Section titled “Image: inspect the result”The Image tab appears after the debug run saves its output. It shows what that run produced, with a checkerboard behind images to make transparency visible. PDF output opens in an embedded viewer. Click Open in new tab for a larger view.

Try an example with console logs and errors
Section titled “Try an example with console logs and errors”The sample daily report HTML deliberately produces console log, info, debug, warning, and error messages, a failed assertion, and an uncaught TypeError with named stack frames. The optional chart fails while the rest of the report remains ready to capture. The example uses sample data and makes no external requests.
Copy the example’s HTML source into the dashboard’s Image Console and enable render_when_ready. It adds the HCTIReadyNow element after the diagnostics have run, so capture waits until the report is ready. Create the image, open Debug render, and start a run.
In Logs, filter by severity or search for [Demo]. Expand the uncaught error to inspect the initializeOptionalChart, renderRevenueChart, and validateChartData stack frames. Compare the messages with the Image tab to see that a page error can occur even when an image is successfully captured.

In this run, Preparing page reports three problems: the console.error() message, the failed assertion, and the uncaught TypeError. The Render when ready wait still completes, followed by Capture, Saving, and Request completed. The example makes no external requests, so its Requests count is zero.
What events are included?
Section titled “What events are included?”Events appear when the corresponding operation occurs. For example, a render that fits in one screenshot won’t include tile capture events.
| Category | Included events and details |
|---|---|
| Steps | Phase starts; cache checks; renderer requested; browser ready; page opened; proxy authenticated; page ready; template loaded; navigation completed; emoji replaced; consent banners hidden; render and request completion. Navigation details can include the requested and final URLs, HTTP status, page title, and signs of a bot challenge. |
| Network | Page network requests and blocked requests, including outcomes, HTTP status, timing, cache use, redirects, failure details, and initiators when available. |
| Console | Console messages, including log, debug, info, warning, and error output, with source locations and stack traces when available. |
| Errors | Request errors, browser errors, uncaught page exceptions, and notices that events were dropped. |
| Waits | Delays, warmup scroll pauses, page and HTML content loading, network quiet, render-when-ready, selector lookup and visibility, and font or layout settling. Details include duration, outcome, and the time limit when available. Selector lookup also reports whether the element was found and its position and dimensions. |
| Settings | Settings applied during rendering, such as viewport, device scaling, emulation, and custom CSS. Expanded details show values, previous values when available, and why the settings were applied. |
| Capture & image | Screenshot or PDF capture and its outcome; tiled capture start, individual tiles, tile merging, and completion; scaling down, cropping, resizing, encoding, transform completion or skipping, and image storage. Capture details can include font counts. |
Long messages and URLs may be truncated. If a page produces too many console messages, page errors, or network events in a second, some are omitted and an Events dropped notice appears.
Use the findings to fix your image
Section titled “Use the findings to fix your image”- Missing images, fonts, or styles: look for failed requests or HTTP errors in Requests, then check the resource URLs and access requirements.
- Blank or incomplete content: check Logs for script errors and Events for waits that timed out. Review
render_when_ready,ms_delay, andmax_wait_msto control when capture happens. - Unexpected cropping or size: expand Selector lookup and Settings applied events to check the target element’s bounds and the applied viewport or scaling.
- Slow renders: inspect phase durations and request waterfalls to see whether time went into loading resources, waiting for content, capture, or saving.
- A challenge page instead of your website: inspect Navigation completed for challenge signals and follow the Cloudflare challenges guide for a site you control.
A timed-out wait or a blocked request is a clue to investigate; it does not always mean the entire render failed. Check the final run status and output as well.
The debugger runs saved settings. After changing your HTML, CSS, or request parameters, create or update the image with those changes, then debug that image to check the result.
Revisit a recorded run
Section titled “Revisit a recorded run”Recent debug runs lists the result, event count, and duration of previous runs. Click View on a finished run to load its recorded events and output. The Recorded run label identifies a recording; viewing it does not start another render. Click New debug render to run the image again.
Runs are available to view for 7 days. An Incomplete run did not finish and has no recording to replay.
Availability and limits
Section titled “Availability and limits”Debug renders require a plan that includes them and a member role with permission to start them. Viewing recordings requires permission to read debug runs. The dashboard shows how many debug renders your organization has left in the current billing period.
Starting a run uses one debug render from that allowance, including runs that fail. Your organization can start up to 5 debug renders per minute, shared across the dashboard with REST API endpoints and MCP tools coming soon.
Need help?
Talk to a human. Email support@htmlcsstoimage.com and we’ll help you get started.