
The image debugger is now in beta. Use it to investigate images that look wrong, render slowly, or fail. A debug render runs an existing image again with its saved settings, bypasses the cached output, and streams diagnostics as the render happens.
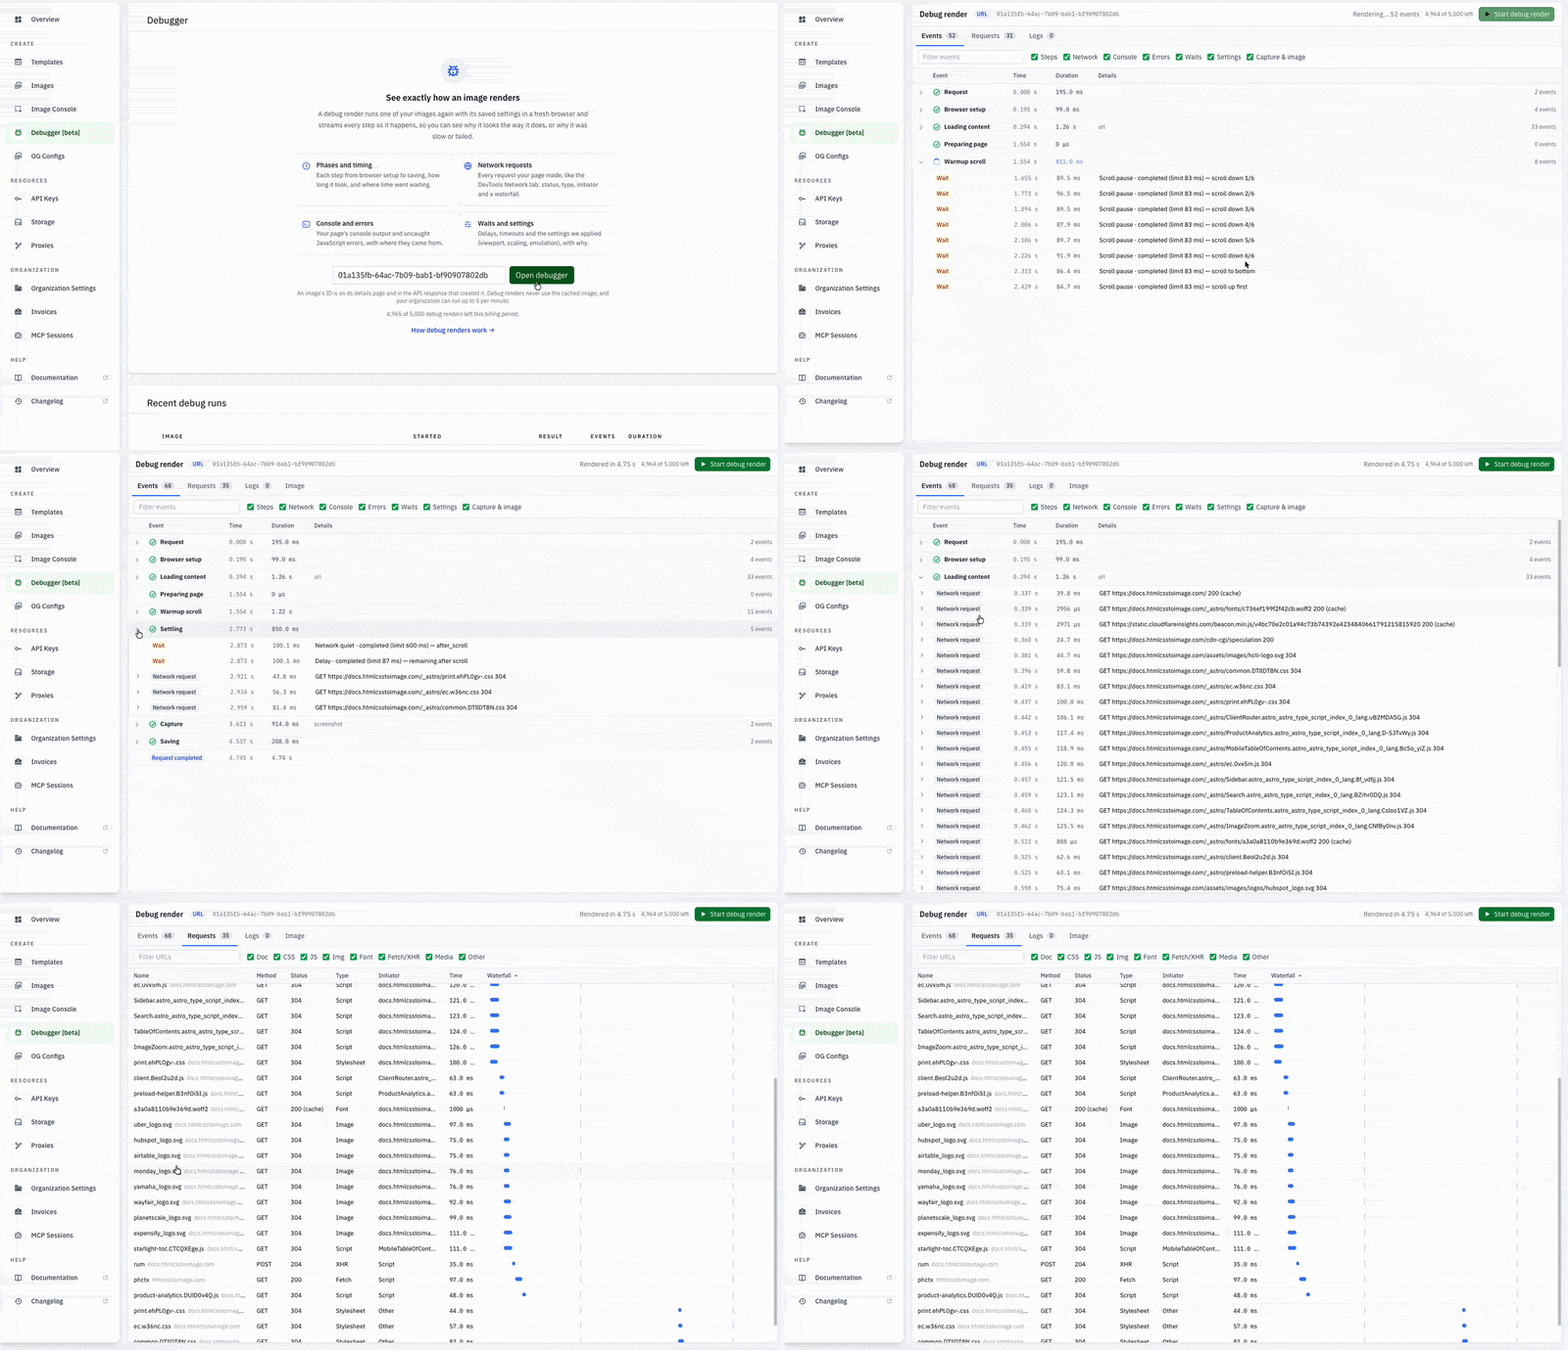
Open an image’s details in the dashboard and click Debug render, or select Debugger [beta] in the navigation and enter an image ID. Click Start debug render to inspect:
- Events: render phases, timing, waits, applied settings, and capture steps.
- Requests: resource URLs, statuses, initiators, failures, and a network waterfall.
- Logs: console output and uncaught JavaScript errors, with source locations and stack traces when available.
- Image: the output captured by that debug run.
Finished runs can be revisited for 7 days through Recent debug runs. Debug renders are available on plans that include them; the dashboard shows your organization’s remaining allowance.
See Using the image debugger for a walkthrough, screenshots, and a sample HTML report with intentional console messages and errors.